Table of Contents
There is a number that investors love to throw around at dinner parties. Price to book. P/B ratio. It sounds clean. It sounds rational. You take what the market says a company is worth, divide it by what the accountants say it owns, and out comes a verdict. Cheap or expensive. Buy or pass.
Except the verdict is lying to you about half the time.
Not because the math is wrong. The math is always right. But because the question the ratio answers depends entirely on what kind of company you point it at. Use P/B to evaluate a steel manufacturer and you get one story. Use it to evaluate a software company and you get a completely different one. Same formula. Same output. Totally different meaning.
This is the quiet problem at the heart of one of investing’s most popular metrics. And understanding it requires looking at two fundamentally different ways companies are built.
The World Split in Two
Every business needs stuff to operate. But the nature of that stuff varies wildly.
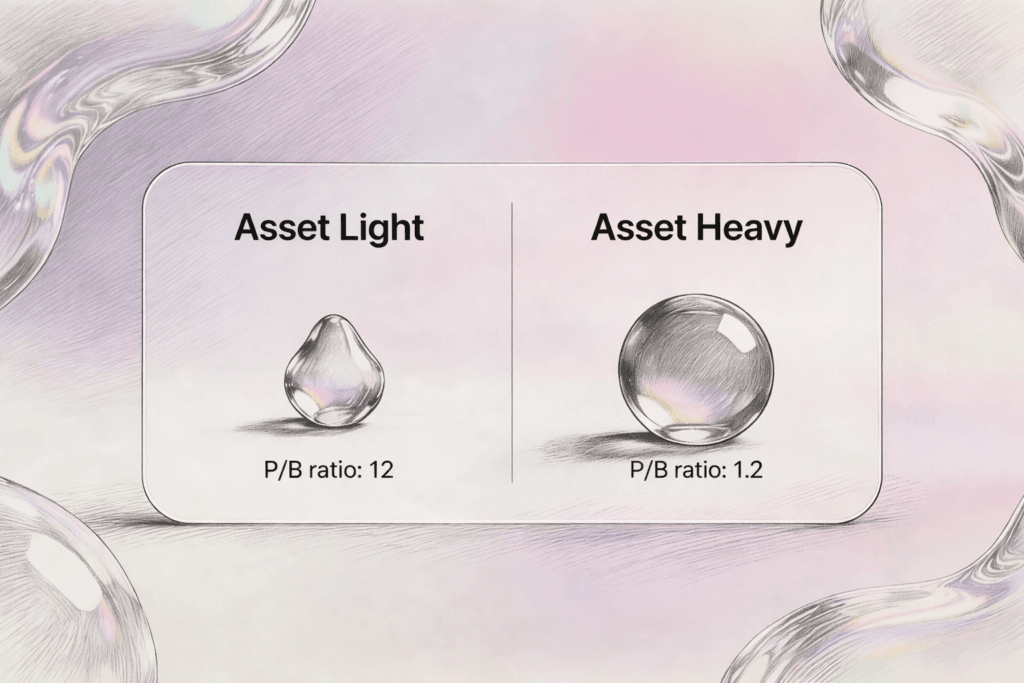
Some companies need enormous physical footprints. Factories. Warehouses. Fleets of trucks. Drilling rigs. Real estate. These are asset heavy businesses. Their balance sheets are thick with tangible property. Think of an airline. Before a single passenger boards, the company has already spent billions on planes, maintenance facilities, and gate infrastructure. The assets are real. You can touch them. You can kick the tires, literally.
Other companies need almost none of that. A consulting firm rents office space and hires smart people. A software company writes code that lives on rented servers. A brand licensing company owns a logo and an idea. These are asset light businesses. Their balance sheets look almost empty by comparison. The value lives in places that accounting standards struggle to capture.
Here is where things get interesting. When you calculate P/B for an asset heavy company, the book value in the denominator actually reflects most of what the company owns. Steel mills show up on the balance sheet. So do cargo ships and oil refineries. The number means something. It gives you a rough sense of what the company’s physical infrastructure is worth relative to what the market is charging you for it.
But when you calculate P/B for an asset light company, the book value is almost a fiction. Not because anyone is lying. Because the accounting rules were written for a world of factories and railroad tracks. They were not designed for a world where the most valuable thing a company owns is an algorithm or a customer relationship or the collective expertise inside people’s heads.
Why Book Value Breaks Down
This is worth sitting with for a moment because it reveals something deeper about how we measure value.
Accounting follows a principle of conservatism. If you cannot reliably measure something, you do not put it on the balance sheet. This made perfect sense in the industrial era. A factory cost a known amount to build. A machine had a purchase price. You could depreciate these things on a schedule and everyone agreed on roughly what they were worth.
But what is the book value of Google’s search algorithm? What is the balance sheet entry for Nike’s brand? How do you depreciate the institutional knowledge inside McKinsey? You don’t. These things either never appear on the balance sheet at all or they show up at absurd values that bear no resemblance to their economic worth.
The result is a strange optical illusion. Asset light companies often trade at P/B ratios of 10, 20, sometimes 50 or more. An investor trained to look for “cheap” stocks with low P/B ratios would never touch them. They would walk right past some of the greatest wealth creators of the last three decades because a formula told them the price was too high relative to the book.
Meanwhile, asset heavy companies often trade at P/B ratios near 1, sometimes below it. They look cheap. They look like bargains screaming to be picked up off the floor. And sometimes they are. But sometimes a P/B below 1 is the market’s way of telling you that the physical assets on the balance sheet are worth less than the accountants think. A steel mill valued at 500 million on the books might only fetch 200 million if you tried to sell it tomorrow. Book value is not liquidation value. That distinction matters more than most people realize.
The Intellectual Trap
There is a certain kind of investor who falls in love with P/B precisely because it feels rigorous. It feels grounded. You are comparing price to something tangible. Something real. It appeals to the same part of the brain that prefers cash in a safe over numbers on a screen.
But this preference for the tangible is itself a bias. We trust what we can see and touch more than what we cannot, even when the intangible thing is demonstrably more valuable. A warehouse full of inventory feels like wealth. A brand that commands premium pricing feels like marketing fluff. Until you look at the profit margins and realize the brand is generating three times the return on capital.
This is one of those places where investing intersects with cognitive science in a way that should make every P/B devotee a little uncomfortable. The metric feels objective. But the decision to rely on it is driven by a subjective preference for the concrete. And that preference systematically steers you toward one type of business and away from another, regardless of which one is actually the better investment.
Two Companies, One Ratio, Zero Comparability
Let us make this concrete with a thought experiment.
Company A is a regional bank. It has 10 billion in assets on its balance sheet, mostly loans and real estate. The market values it at 12 billion. P/B ratio of 1.2. Looks reasonable. Maybe even a touch expensive for a bank.
Company B is a software platform. It has 500 million in assets on its balance sheet, mostly cash and some office equipment. The market values it at 15 billion. P/B ratio of 30. Looks insane. Thirty times book value. What are these people thinking?
But Company B generates 2 billion in annual revenue with 40% profit margins, growing at 25% a year, with almost no capital expenditure required. Company A generates 800 million in revenue with 15% margins, growing at 3%, and needs to constantly reinvest in its physical infrastructure just to maintain operations.
Which one is actually expensive?
The P/B ratio cannot answer this question. It was never designed to. It is comparing two fundamentally different economic architectures using a single measuring stick and pretending the measurement means the same thing in both cases. It is like using a thermometer to measure the depth of a swimming pool. The instrument works fine. You are just asking it the wrong question.
The Return on Equity Bridge
There is a way to rescue P/B from irrelevance, and it involves connecting it to another metric: return on equity. ROE measures how much profit a company generates relative to its book equity. And this is where the asset light vs. asset heavy distinction becomes truly illuminating.
Asset light companies tend to have extraordinary returns on equity. When your book equity is small because you do not need factories or fleets, even modest profits produce enormous ROE figures. A software company with thin book value and strong profits might show ROE of 40% or higher. The market sees this and rightly assigns a high P/B ratio because the equity base is generating returns far above the cost of capital.
Asset heavy companies tend to have modest returns on equity. When your balance sheet is bloated with depreciating physical assets, you need substantial profits just to generate a respectable ROE. A utility company might show ROE of 8 to 10 percent. The market sees this and assigns a low P/B ratio accordingly.
So here is the insight that transforms how you read the number. A high P/B ratio paired with a high ROE is not necessarily expensive. It is the market correctly recognizing that a small equity base is being put to extraordinarily productive use. And a low P/B ratio paired with a low ROE is not necessarily cheap. It is the market correctly recognizing that a large equity base is generating mediocre returns.
The P/B ratio, read in isolation, tells you almost nothing. Read alongside ROE, it starts to tell a story.
The Contrarian Corner
Now, here is where things get uncomfortable for the asset light enthusiasts who have been nodding along.
Asset light businesses are wonderful until they are not. The same absence of physical infrastructure that produces gorgeous returns on equity also means there is often very little standing between the company and oblivion. A software platform with no physical assets is also a software platform with no physical moat. Someone else can write code too. The barriers to entry in many asset light businesses are lower than their investors would like to admit.
An oil refinery, by contrast, is its own moat. Nobody wakes up one morning and decides to build a competing refinery next door. The sheer weight of the physical assets creates a barrier that protects incumbents, even inefficient ones, for years or decades. There is a reason Warren Buffett, who certainly understands the math of asset light models, has spent billions buying railroads and energy infrastructure. Physical assets you cannot easily replicate have a durability that elegant business models sometimes lack.
The P/B ratio actually captures something important here, just not what most people think. A low P/B on an asset heavy business might be telling you that the assets are durable even if the returns are modest. A high P/B on an asset light business might be telling you that the returns are spectacular but the whole thing could evaporate faster than you expect.
Asset light companies can scale fast, pivot quickly, and generate explosive returns. But they are also more fragile. When conditions change, their lack of physical roots makes them vulnerable. Asset heavy companies are slower, more cumbersome, harder to redirect. But they endure. They survive economic winters that wipe out flashier competitors.
What to Actually Do With This
If you have read this far, you might be wondering whether P/B is worth using at all. It is. But only if you use it correctly.
Within asset heavy industries, P/B is genuinely useful for comparison. Comparing one bank’s P/B to another bank’s P/B tells you something meaningful. Comparing one steel company to another steel company. One utility to another utility. The denominator is capturing similar types of assets, so the ratio produces apples to apples comparisons.
Within asset light industries, P/B is mostly noise. You are better off looking at price to earnings, price to free cash flow, or enterprise value to revenue. These metrics at least attempt to measure what asset light companies actually produce rather than what they physically own, which is not much.
Across industries, comparing P/B ratios is somewhere between useless and actively misleading. Saying that a bank with a P/B of 1.2 is “cheaper” than a software company with a P/B of 30 is like saying a bicycle is cheaper than a house. Technically true. Completely irrelevant to the decision you are trying to make.
Every financial metric is a lens. And every lens distorts as much as it reveals. The P/B ratio was born in an era when corporate value lived primarily in physical things. It still works in that world. But the economy has drifted steadily toward a world where value lives in ideas, networks, brands, and relationships. Things that do not sit neatly on a balance sheet. Things that make the denominator in P/B an increasingly unreliable guide to what a company is actually worth.
The investors who understand this do not abandon P/B. They just know when to pick it up and when to put it down. They recognize that the number is a tool, not a truth. And that the most dangerous thing in investing is not a bad metric. It is a good metric applied to the wrong situation with absolute confidence.
That confidence, more than any ratio, is what actually gets expensive.