Table of Contents
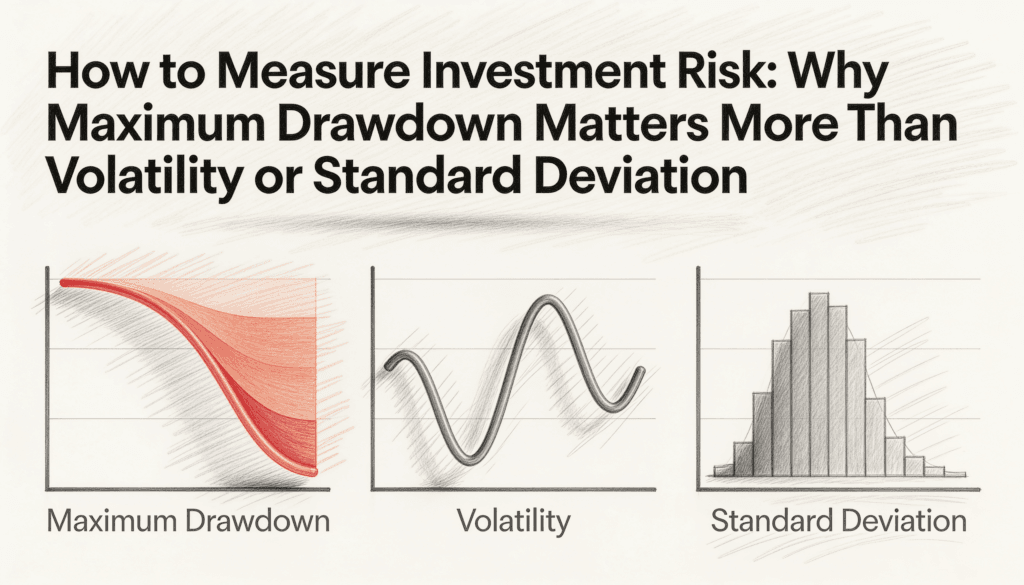
Why Maximum Drawdown Is the Most Honest Way to Measure Investment Risk
Every investor I have ever met can recite their returns. Ask them about last year, and they will quote you a percentage with the confidence of a weatherman pointing at a sunny map. Ask them about their maximum drawdown, and you will usually get a pause, a tilted head, and a vague answer about how things got “a bit rough for a while.”
This is strange when you think about it. To measure investment risk properly, you need to understand drawdown, which is the measurement of how far your portfolio fell from its highest point before it started climbing again. It is the peak to trough distance, the depth of the valley between two mountains. If your account hit one hundred thousand dollars and then sank to sixty thousand before recovering, your maximum drawdown was forty percent. That is the number. That is what your money actually went through.
And yet most people treat it like an embarrassing relative they would rather not introduce at parties. The reason is simple. Returns flatter us. Drawdowns expose us. If you want to know how to measure investment risk in a way that reflects your real experience as an investor, maximum drawdown matters more than volatility or standard deviation, and the rest of this article will show you exactly why.
The Mirror We Refuse to Look Into
There is something almost philosophical about why we obsess over returns and ignore drawdowns. Returns tell us a story about who we are. They suggest skill, foresight, perhaps a touch of genius. Drawdowns tell us a different story, one we are less eager to hear. They reveal what we endured, what we tolerated, and crucially, what we almost did not survive.
Imagine two investors. The first earned twelve percent last year with a maximum drawdown of eight percent. The second earned fifteen percent with a maximum drawdown of forty five percent. At the end of the year, they meet at a dinner party. Guess which one tells the better story. Guess which one actually had the better year, measured by any honest accounting of human experience.
The second investor lived through something the first did not. They watched almost half of their savings evaporate and then waited, sweating, hoping, possibly not sleeping, for it to come back. The fact that it did is partly skill and partly luck. The fact that they stayed in the seat long enough to find out is its own kind of accomplishment. But it is not something most people would willingly repeat.
Returns are what you brag about at dinner parties. Drawdowns are what actually happened to your money while nobody was watching.
What Maximum Drawdown Actually Measures
In plain language, maximum drawdown is the largest peak to trough decline your portfolio experienced over a specific period, expressed as a percentage. It does not care about averages. It does not smooth anything out. It points directly at the single worst stretch you lived through and says, here, this is the wound.
That specificity is exactly why it is so useful. Volatility and standard deviation describe how much your returns wobble around an average, including the upward wobbles, which no investor has ever complained about. Maximum drawdown isolates the part that actually hurts: the downside, the depth of the fall, the distance you had to climb back.
The Math That Punishes the Brave
Here is where finance gets quietly cruel. The relationship between drawdowns and recovery is not even. It is mocking.
Lose ten percent, and you need to gain about eleven percent to break even. That feels almost fair. Lose twenty percent, and you need twenty five percent. Lose fifty percent, and suddenly you need to double your money just to get back to where you started. Lose eighty percent, and you need a four hundred percent gain. At that point, you do not need a strategy. You need a miracle, or a time machine.
This is the part nobody prints on a brochure. The deeper the hole, the steeper the climb, and the climb gets steeper much faster than the fall ever did. It is like falling off a ladder where each rung you skip on the way down forces you to grow taller on the way back up.
Why Avoiding Losses Beats Chasing Gains
The implication here is uncomfortable. Avoiding large losses is mathematically more valuable than chasing large gains. A boring portfolio that never falls more than fifteen percent will, over decades, often quietly outperform a thrilling portfolio that occasionally falls fifty. The boring one never has to do the impossible work of digging itself out of a deep hole.
Consider what these recovery requirements look like side by side, because the numbers are more dramatic than most people expect:
- A ten percent loss requires roughly an eleven percent gain to recover.
- A twenty percent loss requires a twenty five percent gain.
- A thirty three percent loss requires a fifty percent gain.
- A fifty percent loss requires a one hundred percent gain.
- An eighty percent loss requires a four hundred percent gain.
Notice how the gap explodes as the losses deepen. The gentle slope of small drawdowns turns into a vertical cliff of large ones. This is the single most important reason that maximum drawdown deserves more attention than the headline return sitting next to it.
The Stomach Tax Nobody Puts on a Spreadsheet
There is a cost to drawdowns that never appears in any spreadsheet. Call it the stomach tax. Every percentage point of drawdown is paid not just in money but in sleep, in attention, in the small private erosion of confidence that happens when you watch your savings shrink and wonder if they will ever return.
People who have lived through a forty percent drawdown often do not return to investing the same way they left it. Some never return at all. They sit in cash for the next decade, watching the market climb without them, paying the long quiet price of having been frightened once.
The famous example here is the dot com crash, followed years later by the 2008 financial crisis. Millions of people did not merely lose money. They lost their belief that the market would recover. They spent the following years convinced the whole thing was rigged. The drawdown was not confined to their account statement. It bled into their willingness to participate in the future at all.
A drawdown is a test of whether you will still be there when the recovery comes. The deeper the drawdown, the more people fail that test, and they tend to fail it at the exact worst moment.
This is the part of risk that no clean formula ever captures. The market does not care if you sell at the bottom. The market does not even notice you. But you will spend years noticing, replaying the moment, calculating what you would have today if you had simply held on.
Why Returns Lie and Drawdowns Confess
Returns are easy to manipulate, whether on purpose or by accident. A fund manager can show you a five year return that looks fantastic, conveniently starting just after the last crash. A friend can tell you about their incredible year while leaving out the brutal one that came before it. Anyone can cherry pick a window where the numbers look heroic.
Drawdowns are far harder to hide. They are the scars on the chart. You can change the starting point, change the time frame, change the benchmark, and the drawdown still sits there like a confession. It says, this is what really happened. This is where things got bad. This is what you would have had to live through to earn the returns somebody is bragging about.
How the Investment Landscape Rearranges Itself
When you start evaluating investments by their drawdowns rather than their returns, the world rearranges itself. Strategies that looked brilliant suddenly look reckless. Strategies that looked dull suddenly look wise. The whole landscape shifts, and what you see is no longer the highlight reel but the actual journey.
It is the difference between watching a montage of someone climbing a mountain and reading their journal entries from the climb. Both are true. Only one tells you what it actually felt like at three in the morning when the wind picked up and the rope started to fray.
The Real Definition of Risk
Most people think risk is simply the chance of losing money. That definition is incomplete. The deeper truth is that risk is the chance of losing so much money that you cannot, or will not, stay in the game long enough to recover.
This reframing changes everything. A portfolio that drops ten percent is barely risky in any meaningful sense, because almost anyone can wait that out. A portfolio that drops sixty percent belongs in an entirely different category. The danger is not only that the math is worse, although it certainly is. The danger is that the human being attached to that portfolio is likely to do something irreversible. Sell at the worst moment. Swear off investing forever. Tell their children to stay away from markets for the rest of their lives.
Maximum drawdown is the closest thing finance has to a measure of behavioral risk. It tells you how much pain a strategy will inflict, and therefore how likely you are to abandon that strategy at exactly the wrong time.
The Question Worth Asking
The investor who understands this stops asking, what is the best possible return I could earn? They start asking, what is the worst thing that could happen to me along the way, and could I actually live through it without doing something I will regret?
That second question is the more important one. It is also the one that almost nobody prints on the front of the brochure, because it does not sell the dream. Maximum drawdown is, in a very real sense, a prediction about your future self and how that self will behave when the calm finally breaks.
The Strange Comfort of Knowing the Worst
There is something genuinely liberating about accepting drawdowns as part of the deal. Once you stop pretending that any real investment can deliver returns without occasional pain, you can plan for the pain instead of being ambushed by it.
A drawdown you expected feels completely different from a drawdown that catches you off guard. The first is a known cost of doing business. The second feels like a personal catastrophe. The math behind both is identical. The lived experience is not.
How to Use Maximum Drawdown in Real Decisions
If you have read this far, you might be wondering how to put any of this to work. The good news is that you do not need to learn complicated mathematics. You only need to start asking better questions.
Three Questions That Change Everything
- When someone shows you their returns, ask what their worst drawdown was over the same period. The two numbers together tell a complete story that either one alone hides.
- When you evaluate your own portfolio, look back at the deepest hole it has ever been in and ask honestly whether you could comfortably live through that again, or even twice that depth.
- When you consider a new strategy, do not ask how much it could make. Ask how much it could lose, and how long recovery might take.
These are not pessimistic questions. They are realistic ones. They are the questions that separate the people who get to keep their money from the people who briefly had a great deal of it and then watched it slip away during a panic.
Knowing Yourself Through Your Numbers
The investor who knows their maximum drawdown is the investor who knows themselves. They know what they have already survived, and roughly what they can survive again. They are not gambling on a flattering story about who they wish they were in a crisis. They have data. They have history. They have proof.
Most people invest based on who they imagine themselves to be when everything is calm. Then a real drawdown arrives, and they discover that the calm version of themselves is not the one making decisions in the middle of a panic. The frightened version shows up instead, and that version sells.
A Simple Practice to Adopt Today
Start tracking the maximum drawdown of every position and every strategy you hold, right alongside the returns. Write the worst stretch down. Sit with it. Imagine it happening again next year and ask whether you would hold or fold. If the honest answer is that you would fold, then your portfolio is already too aggressive for the person you actually are, no matter how attractive the returns look on paper.
This single habit will quietly protect you from more financial damage than almost any clever strategy you could adopt. It forces the conversation about pain to happen before the pain arrives, while you can still think clearly.
The Number Behind the Number
Returns are the headline. Drawdowns are the story underneath it. You can spend your entire life chasing returns and ignoring drawdowns, and the market will eventually teach you, in its slow and expensive way, that you had your priorities reversed all along.
Or you can flip the order right now. Look at the depths before you admire the peaks. Build something you can actually live with through whatever the next decade decides to throw at you. When you learn how to measure investment risk through the lens of maximum drawdown rather than volatility or standard deviation alone, you stop investing in fantasies and start investing in reality.
The number that matters more than your returns is the number you do not want to look at. That is precisely why you should look at it first. Because returns tell you what you got. Drawdowns tell you what it cost. And in investing, as in most things in life, the cost is the part that decides whether the prize was ever worth it.