Table of Contents
Why Operating Margin Reveals an Economic Moat Better Than Any Story
Most companies are not special, and the financial statements quietly admit it. If you want to find stocks with a real economic moat, you can skip the slogans, the glossy investor decks, and the confident management storytelling, because there is one number that tells the truth even when executives are spinning a tale. That number is operating margin.
There is a strange ritual among investors. They spend hours reading annual reports, listening to earnings calls, and building elaborate spreadsheets, and then at the end of all that effort they ask the same question they could have asked at the beginning. Does this company actually have something special, or is it just lucky? The honest answer is that most businesses exist in the great middle, neither dying nor truly thriving, grinding out a living against rivals who sell roughly the same thing for roughly the same price. There is no moat, no fortress, no secret sauce. There is just the slow erosion of any temporary advantage they manage to build, like a sandcastle waiting for the next wave.
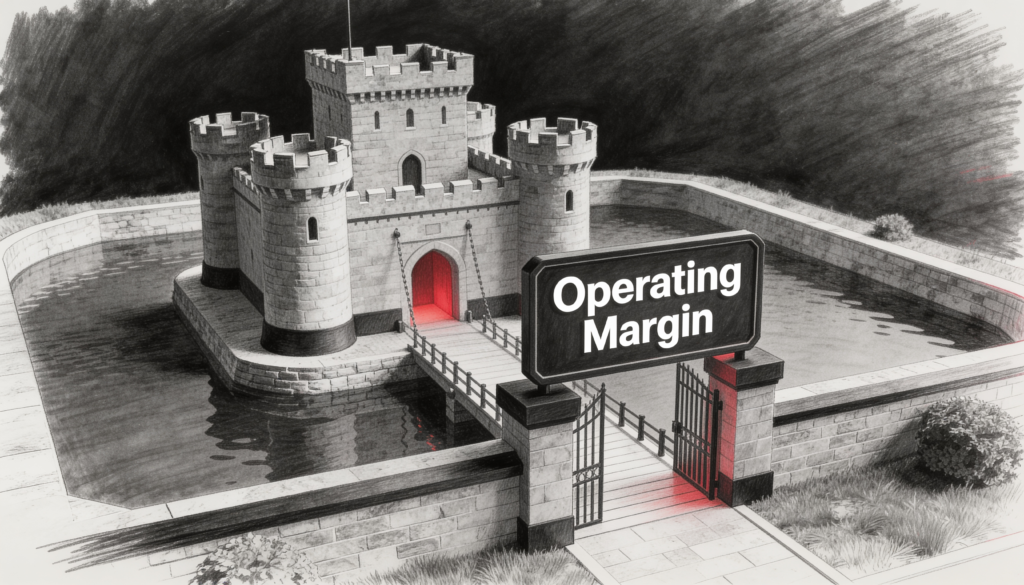
But some companies are different. A small number of businesses have figured out how to charge more, spend less, or do both in a way that competitors cannot easily copy. Warren Buffett called this an economic moat, and the term stuck because it captures something true. A real competitive advantage is defensive. It keeps the barbarians on the other side of the water. The trick, of course, is spotting one before you commit your money.
Companies will swear they have a moat the way teenagers swear they have a plan for the weekend. The claim is loud, and the evidence is thin. So we need something better than narrative. We need evidence that survives scrutiny, and operating margin is the most accessible piece of evidence we have.
What Operating Margin Actually Says
Operating margin is simple to calculate. You take the money a company keeps after paying for the cost of running the business, then you divide it by the revenue that came in. The result is a percentage, and it tells you how much of every dollar in sales survives the journey through the company before taxes and interest take their cut.
If a business sells a hundred dollars worth of goods and ends up with thirty dollars of operating profit, the operating margin is thirty percent. If another business sells the same hundred dollars and ends up with three dollars, the margin is three percent. These two companies live on different planets, even when they appear in the same industry index.
Here is the part that most people miss. The number itself is less interesting than the question it forces you to ask. Why is this number what it is? Why thirty percent and not three? What does the company have, or what is it doing, that allows it to keep so much of each dollar that walks through the door?
A high operating margin is a kind of confession. It admits that something is preventing competitors from showing up and bidding the price down to the cost of production. Whatever that something is, that is the moat. The margin is the shadow it casts.
This is where margin stops being accounting and becomes detective work. You are not just measuring profitability. You are looking for the fingerprints of a competitive advantage that is strong enough to leave a trail in the financial statements.
The Quiet Honesty of a Real Competitive Advantage
Most discussions about competitive advantage involve a lot of words. Brand strength, network effects, switching costs, intellectual property, regulatory protection, and economies of scale. Each of these is real. Each one can build a moat. But individually they are hard to verify from the outside. You can read about them. You can listen to a chief executive describe them. You can sketch them on a whiteboard.
Operating margins are different because they ignore the narrative entirely. A company can claim to have brand power all it wants, but if its operating margin matches every other company in its category, the brand is not doing the economic work. It might be a pleasant brand. People might recognize the logo. But it is not translating that recognition into the ability to charge more or spend less. It is a brand the way a weekend tennis player is a tennis player. Technically true, and practically meaningless.
The reverse holds as well. When you see a company that has been earning unusually high operating margins for many years, something genuine is happening, even when no one can quite articulate what it is. The margin is the receipt for an advantage that is real enough to show up year after year. The story might be hard to tell. The number never lies.
The Time Test for an Economic Moat
Anyone can have a good year. A company might post fat margins because it happened to be in the right industry during a boom, because a competitor stumbled, or because a temporary supply problem let it raise prices. None of this means anything for the long term. The investor who confuses a windfall with a moat is the same investor who later wonders what went wrong.
The real test is duration. A company that has held high operating margins for years, through good times and bad, through new competitors entering and old ones leaving, through technological change and macroeconomic chaos, is telling you something profound. It is telling you that the advantage is structural. The world has thrown everything at this business, and the margin has not flinched.
This is why looking at a single year of margins is almost useless. You need the longer view, because the pattern matters far more than the snapshot. A company whose operating margin stays remarkably steady for a decade is more interesting than a company whose margin spiked once and then drifted back to average. Steadiness is the signature of a real moat. Volatility is the signature of luck.
There is something almost meditative about this kind of analysis. You are not trying to predict the next quarter. You are trying to study a long stretch of history and ask whether the company has been quietly, persistently, almost boringly excellent. The few that have are the ones worth understanding deeply.
Operating Margin Benchmarks by Sector
A common mistake is to compare operating margins across industries and draw sweeping conclusions. Software companies often post margins that look like science fiction next to grocery stores. This does not mean every software company has a moat and every grocer is doomed. It means software and groceries are fundamentally different businesses with different economics. Comparing them directly is like comparing the salaries of surgeons and teachers and concluding that surgeons are smarter.
Margins become meaningful only when you compare a company to its actual peers. To do that well, you need a rough sense of what a normal operating margin looks like in each sector. These ranges shift over time and from one data provider to another, so treat them as guideposts rather than gospel.
- Enterprise software and SaaS: mature leaders often run twenty five to forty percent or higher. A margin below fifteen percent in this group usually means heavy reinvestment or weak pricing power.
- Pharmaceuticals and biotech: established drugmakers frequently sit between twenty five and thirty five percent thanks to patent protection.
- Consumer staples: branded food and household goods companies tend to land between fifteen and twenty five percent, with the strongest brands at the top.
- Semiconductors: highly cyclical, ranging from low single digits in a downturn to thirty percent or more for design leaders in a boom.
- Retail and grocery: notoriously thin, often two to six percent, which makes even a small edge enormously valuable.
- Airlines: volatile and structurally low, frequently below ten percent and sometimes negative.
- Industrial manufacturing: typically ten to eighteen percent, with the best operators stretching higher through automation and scale.
- Utilities: often fifteen to thirty percent on a reported basis, though heavy regulation caps how much of that translates into shareholder value.
The question is never whether a retailer has a higher margin than a pharmaceutical company. The question is whether this retailer has a higher margin than other retailers and whether it has sustained that lead over time. Margin analysis is contextual rather than absolute. The number alone tells you almost nothing. The number relative to peers tells you almost everything.
A Peer Comparison Worked Example
Let us walk through how this looks in practice. Imagine four grocery chains competing in overlapping regions. Their operating margins over the most recent five year average come out like this.
- Grocer A: operating margin of 5.2 percent, holding steady for eight years.
- Grocer B: operating margin of 2.1 percent, drifting slightly lower over time.
- Grocer C: operating margin of 1.8 percent, flat and unremarkable.
- Grocer D: operating margin of 6.4 percent in the most recent year, but only after rising from two percent two years ago.
At first glance, Grocer D looks the most attractive. It has the highest current margin. But the time test changes the picture entirely. Grocer A has earned roughly three full percentage points more than its closest rivals, year after year, for the better part of a decade. In a business where the average competitor scrapes by on two percent, those extra three points are not noise. They are the moat.
What could explain it? Perhaps Grocer A has unmatched scale that lowers its purchasing costs. Perhaps it operates a private label program that competitors cannot replicate at the same quality. Perhaps it simply runs leaner logistics. Whatever the source, the durability of the lead is what makes it believable.
A grocer earning five percent in a world where everyone else earns two percent is doing something special. That extra three percentage points is the moat made visible. The number sends you looking for the cause, and the cause tells you whether the advantage will last.
Grocer D, meanwhile, deserves suspicion rather than applause. A margin that tripled in two years could reflect a real operational turnaround, or it could reflect a temporary tailwind, an accounting change, or deferred spending that will eventually catch up. You would need to dig into why the number jumped before you trusted it. This is the entire discipline in miniature. Compare within the peer group, weight the long record over the recent spike, and let the margin point you toward the right question.
When High Operating Margins Lie
Now comes the uncomfortable part. High operating margins are not always proof of an economic moat. Sometimes they are a warning flag waving in plain sight.
A young company in a hot industry might post enormous margins because it has the field to itself, but that field will soon be flooded with imitators armed with venture capital and ambition. The margins will collapse, the moat that never existed will fail to materialize, and the early numbers will turn out to have been a mirage shimmering on the desert floor. Pricing power that depends on a temporary absence of competition is not pricing power at all.
Other times, high margins reflect underinvestment. A company that stops spending on research, marketing, or maintenance can show wonderful margins for a few years while it quietly liquidates its own future. This is a classic trick of mature businesses in slow decline. They cut, the margins look magnificent, the stock holds up for a while, and then one day the underinvestment shows up as obsolescence. The moat was never a moat. The company was eating its own seed corn and calling the result profitability.
So margins need company. You want to see high margins sitting alongside healthy reinvestment, stable or growing market share, and customers who keep coming back. When all of those signals line up, the moat is probably real. When margins are high but the company is shrinking, or starving its own future to flatter the present, something else is going on.
How to Use the Number to Find Moat Stocks
So what do you actually do with operating margin once you have it? You use it as a starting point, never as a final verdict. A high and stable operating margin relative to peers is not proof of a moat by itself. It is a reason to ask the next question with real urgency.
What is producing this margin? Is it scale? A unique distribution system? A brand that customers genuinely pay extra for? A patent or a regulatory advantage? A cost structure that competitors cannot match? The margin sends you hunting for the cause, and the cause, once identified, tells you whether the moat is durable or fragile.
Patents expire. Brands can fade. Regulation can change. Scale can be matched by a larger competitor with deeper pockets. Some moats run deeper than others, and the only way to know which is which is to figure out what is really doing the work. Here is a practical sequence you can apply to any candidate.
- Pull at least ten years of operating margins, not one or two.
- Line the company up against three or four genuine peers in the same industry.
- Confirm that the company leads its peers and has done so consistently, not just recently.
- Check that reinvestment, market share, and customer retention support the margin rather than contradict it.
- Identify the specific source of the advantage and ask how easily it could be eroded.
What margin gives you is permission to spend your time on the right companies. Most businesses do not have a moat, and the margin filter narrows the field dramatically. It points you toward the small number of companies where the moat conversation is actually worth having. Everything else is just a business fighting for its life in a fair fight, with no advantage to defend and no reason to expect unusual long term returns.
The X-Ray Vision of a Patient Investor
There is something almost poetic about how operating margins work. They begin as a dry accounting concept and end up telling you whether a company is genuinely special. Not because the number itself is magical, but because of what the number forces you to confront. If a company keeps more of its revenue than its rivals, for longer than seems reasonable, then something powerful is happening. The world is not normally so generous.
Profits attract competition the way sugar attracts ants. When profits persist despite the ants, year after year, you are almost certainly looking at a fortress rather than a lucky streak.
The investor who learns to read margins this way develops a kind of x-ray vision. Past the stories, past the slogans, past the carefully curated investor presentations, the numbers reveal whether a company is genuinely defended or merely well dressed. Most are well dressed. A few are truly defended. The entire game is learning to tell the difference.
Operating margin is the simplest, oldest, and most reliable tool we have for that purpose. Use it as a filter, compare within the peer group, demand a long record, and always chase the cause behind the number. Do that consistently, and you will spend your research time where it actually pays off, on the rare businesses that have built a moat deep enough to keep the competition on the far side of the water for years to come.