Table of Contents
What Free Cash Flow Actually Is, in Plain English
There is a moment in every investor’s life when they realize that earnings, the sacred number plastered across financial headlines, is essentially a story. A well told story, sometimes audited, often massaged, but a story all the same. Free cash flow is what remains after the story ends and someone actually has to pay the bills.
Free cash flow, often shortened to FCF, is the cash a company generates from its operations after it has paid for the investments needed to keep the business running and growing. That includes new equipment, factories, software, delivery trucks, and whatever else keeps the lights on. It is the money left over once the company has covered both its day to day costs and its long term capital needs.
Put simply, free cash flow measures what a company truly has in its pocket, as opposed to what it claims it made on paper. In a world obsessed with quarterly performance, that distinction changes everything about how you evaluate a stock.
The Free Cash Flow Formula
There are two common ways to calculate free cash flow, and both arrive at roughly the same place. The simplest version looks like this:
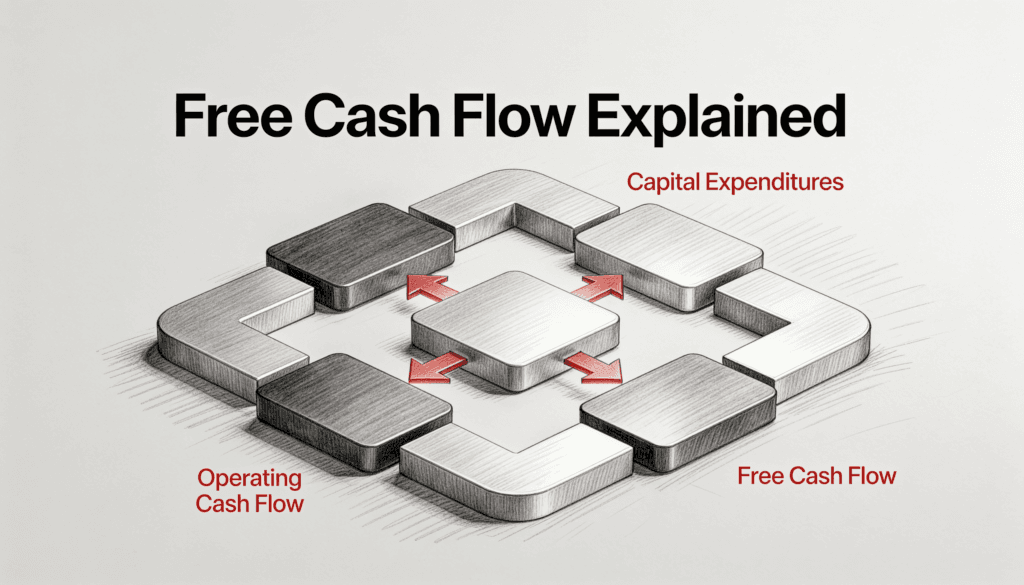
- Free Cash Flow = Operating Cash Flow minus Capital Expenditures
Operating cash flow appears near the top of the cash flow statement. Capital expenditures, frequently labeled CapEx, appear in the investing section. You subtract one from the other, and you have your number. Both figures sit on the cash flow statement of every public company, which means you can find them in 2 minutes on any financial website.
A slightly more detailed version starts from net income and adds back non cash charges:
- Free Cash Flow = Net Income + Depreciation and Amortization + Non Cash Charges minus Changes in Working Capital minus Capital Expenditures
The first formula is enough for most investors. The second is useful when you want to understand exactly where the cash is coming from and where it is leaking out. Either way, the goal is the same: figure out how much real money the business produces after keeping itself alive.
Earnings can be engineered. Free cash flow has to actually exist in a bank account. That single fact is why professional investors trust the cash flow statement more than the income statement.
Why Free Cash Flow Beats Earnings
Earnings are calculated using something called accrual accounting, which is a polite way of saying that companies can record sales they have not been paid for yet and delay recognizing expenses they have already incurred. This is legal. It is standard.
Free cash flow ignores all of that. It asks one brutally simple question. After paying for everything the business needs to keep running, how much money is actually left over? There is no interpretation, no assumption about how long a machine will last, and no clever timing of when revenue gets recognized. There is only cash going in, cash going out, and whatever remains.
The Accountant’s Magic Trick
Think about your own finances for a moment. If a friend tells you they made 100,000 dollars last year but cannot pay back the 50 dollars they owe you, something is off. Either they spent it all, or they never really had it, or it is tied up somewhere they cannot reach.
Companies behave the same way. A business can grow revenue at impressive rates while quietly hemorrhaging cash. This usually shows up as inventory piling up in warehouses, customers taking longer to settle their bills, or capital expenditure swallowing every dollar that walks through the door. The investor who understands free cash flow is the friend who asks for the 50 dollars back. They cut through the marketing and look at what is genuinely happening.
Where Earnings Hide the Truth
Several accounting techniques can make earnings look healthier than the underlying reality. Aggressive revenue recognition pulls future sales into the current quarter. Stretching the useful life of assets reduces reported depreciation. One time charges can be conveniently labeled as unusual so investors learn to ignore them, even when they recur every single year.
None of these tricks change the bank balance. A company can report record net income while its cash position shrinks, and that gap between reported profit and real cash is exactly where many disasters begin. When earnings rise but free cash flow falls for several quarters in a row, treat it as a warning siren.
Free Cash Flow Yield, the Metric Almost Nobody Discusses
Now we arrive at the metric that rarely comes up at dinner parties, which is precisely why it is so useful. Free cash flow yield is what you get when you take a company’s free cash flow and divide it by its market capitalization. The result is a percentage that tells you, in plain terms, what cash return you would theoretically earn if you owned the entire company outright.
- Free Cash Flow Yield = Free Cash Flow divided by Market Capitalization
There are no models, no discount rates, and no assumptions about growth rates 20 years from now that no human being can actually predict. Just a percentage you can calculate on the back of a napkin.
A Worked Example You Can Follow
Imagine a company called Riverside Manufacturing. Here are the figures you pull from its financial statements:
- Operating cash flow: 500 million dollars
- Capital expenditures: 150 million dollars
- Market capitalization: 5 billion dollars
First, calculate free cash flow. You subtract CapEx from operating cash flow, which gives you 500 million minus 150 million, or 350 million dollars of free cash flow.
Next, calculate the yield. You divide 350 million by 5 billion, which produces 0.07, or a free cash flow yield of 7 percent.
That 7 percent figure is enormously informative. It means that for every dollar you invest at the current price, the business generates 7 cents of genuine cash each year. You can now compare that number directly against the yield on a government bond, the dividend yield of a competitor, or the free cash flow yield of any other company on earth.
Why It Beats the P/E Ratio
The price to earnings ratio is the financial world’s favorite party trick. It tells you how much you pay for each dollar of earnings. But earnings, as we have established, can be massaged like a tense shoulder. Free cash flow yield is far harder to fake. You either generated the cash or you did not. The bank statement is the bank statement.
If you could choose only one number to judge a business, free cash flow yield would beat the price to earnings ratio every time. One can be polished by accountants. The other is verified by reality.
The Dying Business Trap, When High Free Cash Flow Lies
Here is where intelligent investors separate themselves from the crowd. A high free cash flow yield is not automatically good, and a low yield is not automatically bad. The number alone tells you nothing about whether the cash will still be there next year.
The Melting Ice Cube
A company sporting a screaming 20 percent free cash flow yield might look like a gift from the investing gods. It might also be a melting ice cube. Newspaper companies in the early 2000s carried gorgeous free cash flow yields right before the entire industry got eaten alive by the internet. The market was not stupid. It was pricing in the fact that the cash would evaporate within a few years.
This is the dying business trap. A declining company can throw off enormous cash for a while precisely because it has stopped investing in its own future. Management harvests the business, slashes CapEx, and the free cash flow looks magnificent on the way down. By the time the cash stops flowing, the patient investor who chased the yield is holding a stock worth a fraction of what they paid.
The Opposite Mistake
The reverse error is just as costly. A company with a tiny free cash flow yield might be reinvesting every available dollar into growth that pays off enormously later. Amazon did exactly this for years. Investors who looked only at the yield missed one of the great wealth creation stories of our lifetime.
The skill is not finding high yield. It is finding sustainable yield, the cash flow that will still be there in 5 years, 10 years, and 20 years. That is the difference between a genuine value investor and someone who walked straight into a value trap.
How to Tell the Difference
A few practical checks help you separate a healthy cash machine from a dying business:
- Look at the trend in free cash flow over the past 5 to 10 years, not a single snapshot.
- Check whether the company is cutting capital expenditure below the level needed to maintain its assets. Suspiciously low CapEx can flatter a yield temporarily.
- Examine whether revenue and unit volumes are growing, flat, or shrinking. A growing top line with rising cash flow is the strongest combination.
- Compare the company against its industry. An entire sector in structural decline is a red flag no matter how attractive the headline yield appears.
- Read the management commentary to understand whether they are investing for the future or quietly winding the business down.
The Buffett Connection and the Philosophy of Cash
Warren Buffett rarely uses the phrase free cash flow in his shareholder letters. He prefers a term he calls owner earnings, which strips away the accounting fiction and estimates what a business genuinely produces for the people who own it. The concept is almost identical. Buffett became the most successful investor in history partly because he understood that earnings were a story while cash was reality.
He looks at businesses the way a farmer looks at a field. Not how it appears in the glossy brochure, but how much it actually produces season after season. The financial industry, meanwhile, has every incentive to keep things complicated. Complexity sells. If everyone realized that you could evaluate a company with one ratio and a calculator, an entire profession would have to look for new work.
Over long periods, businesses that consistently generate cash tend to make their owners rich. Businesses that consistently consume cash tend to make their owners poor. Everything else is commentary.
The Boring Truth About Wealth
There is something almost philosophical about all this. The financial world is obsessed with stories, narratives, momentum, and themes. The next big thing. The disruptive technology. The visionary founder. Cash cares about none of that. Cash either exists or it does not. A business either creates it or it consumes it.
Nobody writes magazine covers about a paint distributor that boringly produces free cash flow year after year and returns capital to shareholders. Yet these are frequently the businesses that compound quietly for decades while everyone else is busy chasing rockets that flame out. The investor who internalizes this stops getting excited about earnings beats, stops chasing momentum, and starts asking the only question that ever truly mattered. How much cash does this thing produce, and how much am I being asked to pay for it?
How to Use Free Cash Flow to Pick Stocks
When you open your brokerage app, most investors see only a price. They might glance at the P/E ratio or the dividend yield. They almost never check the free cash flow yield, which is a shame, because it sits right there on every financial website in the world, waiting to be calculated.
What a Healthy Signal Looks Like
When you find a company with a stable or growing free cash flow yield meaningfully higher than what you could earn from a safe bond, you have found something worth investigating. This is not an automatic buy, because you still need to confirm the cash flow will continue. But it earns a place on your research list.
When you find a glamour stock with a free cash flow yield near zero or deeply negative, you have found something different. Maybe a future giant in the making. Maybe a company one bad quarter away from disaster. You usually cannot tell which without doing real work. The point is that free cash flow yield does not hand you the answer. It hands you a far better question.
Your Free Cash Flow Stock Checklist
Run any company you are considering through these steps before you commit a single dollar:
- Calculate free cash flow. Take operating cash flow and subtract capital expenditures. Confirm the number is positive and reasonably consistent.
- Calculate the free cash flow yield. Divide free cash flow by market capitalization and compare it against bonds and peers.
- Study the trend. Pull 5 to 10 years of data. Rising free cash flow beats a single strong year.
- Test for sustainability. Ask whether the underlying business is growing, stable, or in structural decline.
- Inspect capital expenditure. Make sure management is not flattering the yield by underinvesting in the company’s future.
- Check the conversion. Compare net income to free cash flow. Healthy businesses convert most of their reported profit into actual cash.
- Look at how the cash is used. Smart reinvestment, sensible buybacks, and reliable dividends signal disciplined management.
A Final Word of Caution
Free cash flow yield is a tool, not a religion. It will mislead you sometimes. A company might show a temporarily inflated yield because it cut back on necessary investment. Another might show a temporarily depressed yield because it is building something significant. The numbers do not think on your behalf. They are the starting point, not the conclusion.
Still, if you had to evaluate a business with a single metric, and you had to choose between reported earnings and free cash flow yield, the better choice should now be obvious. One can be engineered in a conference room. The other has to exist in a bank account. In a world full of carefully crafted stories, that reality is worth a great deal.