Table of Contents
Why Cheap Stocks Keep Tricking Smart Investors
There is a particular thrill that comes with finding a stock trading at 8 times earnings. It feels like walking into a luxury store and discovering a mispriced jacket on the clearance rack. Your pulse quickens, your internal monologue starts whispering things like “the market is sleeping on this one,” and for a moment you feel smarter than everyone else in the room. That feeling is precisely the problem, and understanding why is the difference between buying genuine value and buying an accounting illusion dressed up to look like one.
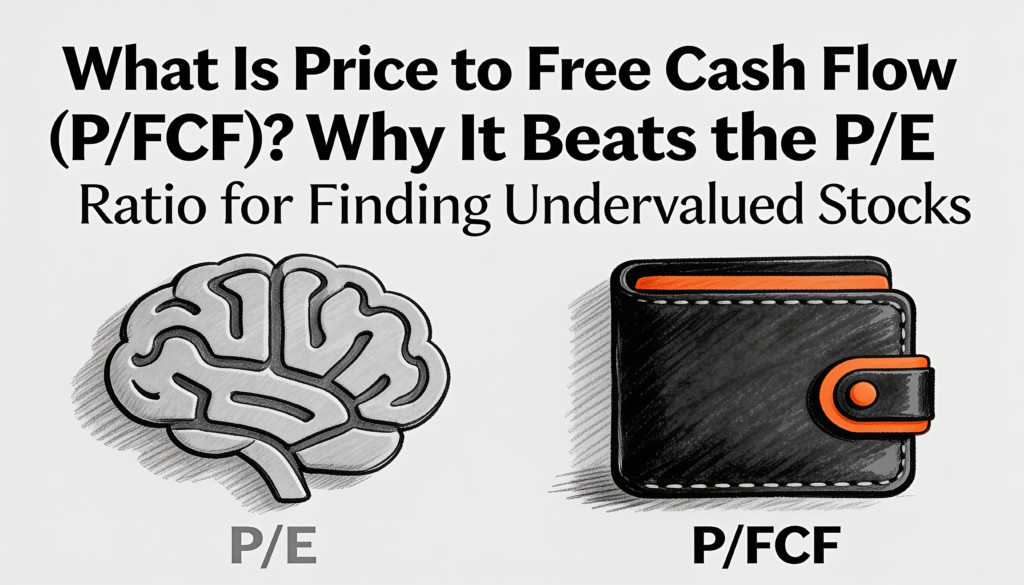
The price to free cash flow ratio, often abbreviated as P/FCF, is one of the most underused tools in stock analysis, and it consistently reveals things that the famous price to earnings ratio hides. This article explains what P/FCF actually measures, why it frequently beats the P/E ratio for finding undervalued stocks, and why your own brain keeps steering you toward the weaker metric without you even noticing.
This is not a case for ignoring earnings. Earnings matter. This is a case for understanding why your mind is drawn to the P/E ratio the way a moth is drawn to a porch light, and why the quieter, less glamorous P/FCF often tells you something much closer to the truth. The difference between the two metrics is mathematical, yes, but it is also deeply psychological.
What Is the Price to Free Cash Flow (P/FCF) Ratio?
The price to free cash flow ratio compares a company’s total market value to the actual cash it generates after covering the costs of running and maintaining its business. You calculate it by dividing the market capitalization by the free cash flow, or equivalently by dividing the share price by the free cash flow per share.
Free cash flow is the money a business has left over after it pays for its operating expenses and its capital expenditures. It is the cash that can be returned to shareholders through dividends, used to buy back shares, deployed to pay down debt, or reinvested to grow. In plain terms, it is the real, spendable money a company produced during a period.
To find free cash flow, you take cash flow from operations and subtract capital expenditures. Both numbers sit on the cash flow statement, which means you do not have to trust the narrative the company tells on its income statement. You simply look at what actually moved through the bank account.
How P/FCF Differs From the P/E Ratio
The price to earnings ratio divides the stock price by earnings per share, where earnings come from net income on the income statement. The price to free cash flow ratio divides the stock price by free cash flow per share, where that figure comes from the cash flow statement. The distinction sounds small, yet it changes everything, because net income and free cash flow are built from very different materials.
Net income is an accounting construct shaped by depreciation schedules, revenue recognition timing, and dozens of legal accounting choices. Free cash flow is closer to a measurement of physical reality. The money either arrived or it did not. It either left or it did not. The bank statement does not negotiate.
How to Read a P/FCF Number
A lower P/FCF generally suggests a company is cheaper relative to the cash it produces, while a higher P/FCF suggests investors are paying a premium for each dollar of cash flow. A P/FCF below 15 is often considered reasonable for a stable business, although context matters enormously. Fast-growing companies usually trade at higher multiples because investors expect future cash flow to climb, and capital-intensive industries naturally carry different benchmarks than asset-light software firms. Always compare a company to its own history and to its direct competitors rather than to a single universal threshold.
Why the P/E Ratio Dominates and Why That Is a Problem
Let us start with why the P/E ratio rules the conversation in the first place. Earnings per share is a clean number. Companies report it every quarter, analysts forecast it, and it appears on every financial summary page in existence. The P/E ratio divides that number into the stock price and hands you what feels like a definitive answer to the question of whether something is cheap or expensive. That is exactly the kind of tidy answer the human brain craves.
The Comfort of Familiarity
Behavioral psychologists have a name for this pull toward the familiar: the fluency heuristic. We tend to trust information that is easy to process. When a concept feels simple and recognizable, we assume it is also accurate and reliable. The P/E ratio is the investing equivalent of a catchy song. You do not need to understand music theory to hum along.
A P/E of 10 feels cheap. A P/E of 40 feels expensive. Done. Move on. Buy the cheap one. The trouble is that fluency and accuracy are two completely separate things. In fact, the easier something is to understand, the less likely we are to question it, and that is exactly where the danger begins.
The metrics that require more effort to understand tend to be the ones that reward you most for understanding them, because the average investor is actively hunting for shortcuts.
The Earnings Illusion
Here is what most people fail to consider when they look at earnings. The number is, to a meaningful degree, a work of interpretation. That sounds dramatic, so let me be precise. Net income, the E in P/E, is governed by accounting rules that permit enormous flexibility in how revenue is recognized, how expenses are timed, how depreciation is calculated, and how one-time charges are classified.
Two companies with nearly identical operations can report very different earnings depending purely on the accounting choices they make. None of this requires fraud. It is all perfectly legal. It simply is not as solid as it appears.
Think of it this way. If earnings are a portrait of a company, they are a portrait painted by the company itself, using brushes chosen from a generous and permissive toolkit. The painting might be beautiful and even mostly accurate, but it remains a painting rather than a photograph. Free cash flow is the photograph. You cannot massage cash the way you can massage earnings, and that is precisely why P/FCF reveals what P/E conceals.
Why P/FCF Beats the P/E Ratio for Finding Undervalued Stocks
A company can report robust earnings while quietly burning through cash. It can display an enticingly low P/E while its free cash flow sits in negative territory. The portrait looks wonderful. The photograph tells a different story entirely. This gap is where serious investors find their edge.
The Divergence That Matters
The real insight lives in the moments when P/E and P/FCF disagree. When a company reports strong earnings but weak free cash flow, it usually points to one of a few situations. The company might be spending aggressively on capital expenditures, which reduces cash but does not immediately hit earnings because that spending gets spread out through depreciation. It might be recognizing revenue before it actually collects the money. It might be benefiting from favorable tax timing. Or it might be managing working capital in a way that flatters the income statement while quietly draining the balance sheet.
None of these scenarios is automatically catastrophic, yet each represents a gap between what the company says it earned and what it genuinely produced in spendable, debt-reducing, dividend-paying cash. A high P/E stock with strong free cash flow can actually be cheaper than a low P/E stock with weak free cash flow. The headline number tells you one thing while the underlying economics tell you another.
The reverse divergence is equally revealing. When a company posts modest earnings but robust free cash flow, the business is often better than it appears. Perhaps it is taking large depreciation charges on assets that still have plenty of useful life. Perhaps it made a major investment a few years ago that is now generating returns while still weighing on the income statement. The P/E looks mediocre. The P/FCF whispers that something more interesting is happening beneath the surface.
A Practical Example of the Two Metrics in Conflict
Imagine two companies, each trading at a P/E ratio of 10, each priced at 100 dollars per share, and each reporting 10 dollars in earnings per share. On the surface they look identical, and a screener filtering for low P/E would treat them as equals.
Now look at the cash flow statements. Company A converts almost all of its earnings into free cash flow, producing 9 dollars per share in real cash. Its P/FCF lands near 11, confirming the bargain. Company B, however, recognized a large slice of revenue it has not yet collected and spent heavily on equipment, so its free cash flow comes in at just 2 dollars per share. Its P/FCF balloons to 50.
Two stocks that looked identical through the lens of earnings are wildly different through the lens of cash. The investor who stopped at the P/E ratio bought a story. The investor who checked the P/FCF bought a business.
Why Your Brain Resists the Better Metric
If free cash flow is more reliable, why does not everyone simply use P/FCF instead? Because it is harder, and the human brain quietly dislikes harder.
The Two Systems of Thinking
Daniel Kahneman, the Nobel laureate who spent his career studying human decision-making, described two systems of thought. System 1 is fast, automatic, and effortless. System 2 is slow, deliberate, and demands concentration. The P/E ratio is a System 1 metric. You glance at it and feel informed. P/FCF is a System 2 metric. Understanding it asks you to consider capital expenditures, working capital shifts, and the difference between accrual accounting and cash accounting.
It is not complicated, but it is not instant either, and in a world where investors swipe through stock screeners on their phones during a coffee break, instant almost always wins.
The Anchoring Trap
There is another psychological force at work here, one that is less discussed yet arguably more powerful: anchoring. Once you see a P/E number, it quietly becomes your reference point, and everything afterward gets judged against it. If a stock shows a P/E of 9, you are already anchored to the conviction that it is cheap.
Now, even when someone demonstrates that the same stock carries a P/FCF of 35 because its free cash flow is a fraction of its reported earnings, you will feel internal resistance. The anchor is already set. Your brain does not want to release the first number it grabbed. This is not a character flaw. It is simply how human cognition operates. But in investing, the distance between how cognition works and how money works can become very expensive.
Cheap on the wrong metric is not cheap at all. It is just a number that made you feel something, and the market has never once cared about your feelings.
The Social Proof Trap
There is also a social dimension worth examining. The P/E ratio is the metric that people talk about. It is the one that shows up in headlines, in casual conversations, and on financial television. When everyone around you reaches for the same yardstick, there is enormous psychological pressure to reach for it too.
This is classic social proof, the tendency to assume that if everyone is doing something, it must be correct. In much of life, social proof is a handy shortcut. If a restaurant is packed, the food is probably decent. But in investing, social proof becomes a trap, because the crowd is not trying to help you. The crowd is the market, and the market is the very thing you are trying to outthink.
Using P/FCF will never make you the star of a dinner party. Nobody has ever charmed a date by saying the price to free cash flow ratio adjusted for normalized capital expenditures suggests otherwise. Yet investing is one of the rare arenas where being a little socially awkward about your methodology can be quietly and substantially rewarding.
How to Use P/FCF in Your Own Analysis
Knowing the theory is one thing. Putting it to work is another. Here is a practical approach that takes only a few extra minutes per company yet meaningfully sharpens your judgment.
A Simple Step-by-Step Process
- Open the company’s cash flow statement and find cash flow from operations.
- Subtract capital expenditures to arrive at free cash flow.
- Divide the company’s market capitalization by that free cash flow figure to get the P/FCF, or divide the share price by free cash flow per share.
- Compare the result to the P/E ratio. If both tell the same story, your bargain may be real. If they diverge sharply, treat that gap as a signal worth investigating.
- Look across several years rather than a single quarter, because one unusual period of heavy spending or one lumpy collection cycle can distort the picture.
Common Mistakes to Avoid
The most frequent error is comparing P/FCF figures across industries that have nothing in common. A utility company and a software firm produce cash in completely different rhythms, so their multiples are not interchangeable. The second common mistake is relying on a single year of free cash flow, which can be temporarily depressed by a major one-time investment or temporarily inflated by a delay in necessary spending. Always normalize free cash flow across a full business cycle when you can.
When the P/E Ratio Still Earns Its Place
None of this means you should discard the P/E ratio forever. For companies with stable, predictable earnings that closely track their cash generation, the two metrics often agree, and the P/E offers a quick and useful read. The P/E ratio also makes broad comparisons across a sector fast and convenient. The wise approach is to treat the P/E ratio as a first glance and the P/FCF as the confirming second look. Use both, and let the disagreements teach you something.
The Real Cost of Mental Shortcuts
We all rely on mental shortcuts because the world is far too complex to analyze everything from first principles every single time. But the shortcuts we select carry consequences, and in investing those consequences compound.
If you consistently evaluate stocks using a metric that can be smoothed, timed, and dressed up, you will consistently overpay for businesses that excel at accounting rather than at generating cash. You will buy the portrait and miss the photograph. Stretched across one or two decades of compounding, that systematic error stops being a rounding error and becomes a genuine difference in how you live.
The edge in investing does not live in consensus. It lives in the gap between what most people glance at and what actually matters.
The irony is sharp. The cheap stock, the one with the low P/E that lights up your brain with the thrill of a bargain, is sometimes the most expensive purchase you can make. Every time you default to the easier metric, you make the same choice as the majority of market participants, and identical analytical choices tend to produce identical, average results.
What to Do With All of This
The next time you discover a stock that looks irresistibly cheap, pause and give it 5 extra minutes. Pull up the cash flow statement, locate free cash flow, calculate the P/FCF, and set it beside the P/E. If they tell the same story, wonderful, you may have found something genuinely undervalued. If they diverge, lean in, because that divergence is information most investors will never bother to uncover. They stopped at the first number that felt good.
Your brain wants the P/E ratio because it is easy, familiar, and satisfying. Your wallet needs the P/FCF because it is honest. In investing, as in most of life, the honest answer and the comfortable answer are rarely the same one. Choosing the honest one, again and again, is how patient investors quietly outperform the crowd that never looks past the surface.